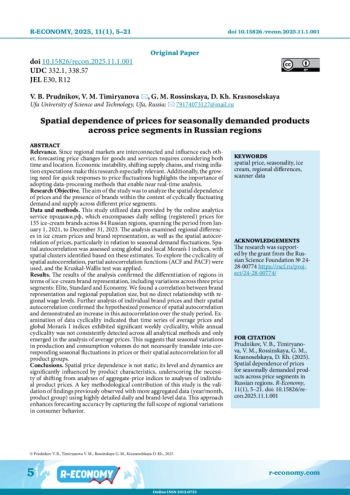
Relevance. Since regional markets are interconnected and influence each other, forecasting price changes for goods and services requires considering both time and location. Economic instability, shifting supply chains, and rising inflation expectations make this research especially relevant. Additionally, the growing need for quick responses to price fluctuations highlights the importance of adopting data-processing methods that enable near real-time analysis. Research Objective. The aim of the study was to analyze the spatial dependence of prices and the presence of brands within the context of cyclically fluctuating demand and supply across different price segments. Data and methods. This study utilized data provided by the online analytics service продажи. рф, which encompasses daily selling (registered) prices for 135 ice-cream brands across 84 Russian regions, spanning the period from January 1, 2021, to December 31, 2023. The analysis examined regional differences in ice cream prices and brand representation, as well as the spatial autocorrelation of prices, particularly in relation to seasonal demand fluctuations. Spatial autocorrelation was assessed using global and local Moran’s I indices, with spatial clusters identified based on these estimates. To explore the cyclicality of spatial autocorrelation, partial autocorrelation functions (ACF and PACF) were used, and the Kruskal-Wallis test was applied. Results. The results of the analysis confirmed the differentiation of regions in terms of ice-cream brand representation, including variations across three price segments: Elite, Standard and Economy. We found a correlation between brand representation and regional population size, but no direct relationship with regional wage levels. Further analysis of individual brand prices and their spatial autocorrelation confirmed the hypothesized presence of spatial autocorrelation and demonstrated an increase in this autocorrelation over the study period. Examination of data cyclicality indicated that time series of average prices and global Moran’s I indices exhibited significant weekly cyclicality, while annual cyclicality was not consistently detected across all analytical methods and only emerged in the analysis of average prices. This suggests that seasonal variations in production and consumption volumes do not necessarily translate into corresponding seasonal fluctuations in prices or their spatial autocorrelation for all product groups. Conclusions. Spatial price dependence is not static; its level and dynamics are significantly influenced by product characteristics, underscoring the necessity of shifting from analyses of aggregate-price indices to analyses of individual product prices. A key methodological contribution of this study is the validation of findings previously observed with more aggregated data (year/month, product group) using highly detailed daily and brand-level data. This approach enhances forecasting accuracy by capturing the full scope of regional variations in consumer behavior.
Идентификаторы и классификаторы
Why do the same goods and services come with vastly different price tags across Russia? The answer lies in a complex web of factors—spanning the country’s immense territory, the isolation of remote regions with extreme climates, and stark socio-economic contrasts between different areas. Numerous studies have documented regional price variations (Goroshchenko L. G., 2013), identified the determining factors (Sinelnikov-Murylev S. G. et al., 2020), and examined the spatial dependence of these differences (Benedetti I. et al., 2022; Wu G. et al., 2019; Tsyplakov A., 2000; Timiryanova V. et al., 2023a). However, these findings are primarily derived from annual or monthly data, limiting their ability to fully capture price dynamics across both space and time (Tsyplakov A., 2000; Timiryanova V. et al., 2023b). To our knowledge, this represents a significant constraint when making management decisions.
Список литературы
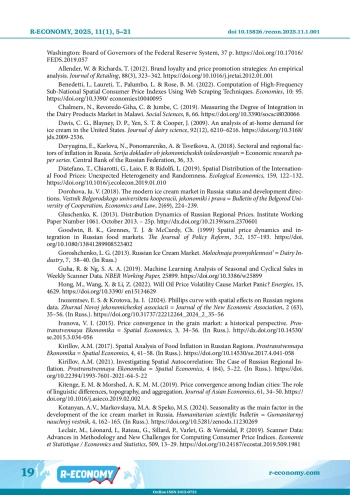
1. Acosta A., Ihle R., von Cramon-Taubadel S. (2019). Combining market structure and econometric methods for price-transmission analysis. Food Security, 11, 941-951. https://doi.org/10.1007/s12571-019-00951-w.
2. Aladangady A., Aron-Dine Sh., Dunn W., Feiveson L., Lengermann P., Sahm, C. (2019). From transactions data to economic statistics: constructing real-time, high-frequency, geographic measures of consumer spending. Finance and Economics Discussion Series 2019-057. Washington: Board of Governors of the Federal Reserve System, 37 p. https://doi.org/10.17016/FEDS.2019.057.
3. Allender W., Richards T. (2012). Brand loyalty and price promotion strategies: An empirical analysis. Journal of Retailing, 88(3), 323-342. https://doi.org/10.1016/j.jretai.2012.01.001.
4. Benedetti I., Laureti T., Palumbo L., Rose B. M. (2022). Computation of High-Frequency Sub-National Spatial Consumer Price Indexes Using Web Scraping Techniques. Economies, 10: 95. https://doi.org/10.3390/economies10040095.
5. Chalmers N., Revoredo-Giha C., Jumbe C. (2019). Measuring the Degree of Integration in the Dairy Products Market in Malawi. Social Sciences, 8, 66. https://doi.org/10.3390/socsci8020066.
6. Davis C. G., Blayney D. P., Yen S. T., Cooper J. (2009). An analysis of at-home demand for ice cream in the United States. Journal of dairy science, 92(12), 6210-6216. https://doi.org/10.3168/jds.2009-2536.
7. Deryugina E., Karlova N., Ponomarenko A., Tsvetkova A. (2018). Sectoral and regional factors of inflation in Russia. Serija dokladov ob jekonomicheskih issledovanijah = Еconomic research paper series. Central Bank of the Russian Federation, 36, 33.
8. Distefano T., Chiarotti G., Laio F., Ridolfi L. (2019). Spatial Distribution of the International Food Prices: Unexpected Heterogeneity and Randomness. Ecological Economics, 159, 122-132. https://doi.org/10.1016/j.ecolecon.2019.01.010.
9. Dorohova Ju. V. (2018). The modern ice cream market in Russia: status and development directions. Vestnik Belgorodskogo universiteta kooperacii, jekonomiki i prava = Bulletin of the Belgorod University of Cooperation, Economics and Law, 2(69), 224-239.
10. Gluschenko K. (2013). Distribution Dynamics of Russian Regional Prices. Institute Working Paper Number 1061. October 2013. - 25p. http://dx.doi.org/10.2139/ssrn.2370601.
11. Goodwin B. K., Grennes T. J., McCurdy Ch. (1999) Spatial price dynamics and integration in Russian food markets. The Journal of Policy Reform, 3:2, 157-193. https://doi.org/10.1080/13841289908523402.
12. Goroshchenko L. G. (2013). Russian Ice Cream Market. Molochnaja promyshlennost’ = Dairy Industry, 7, 38-40. (In Russ.).
13. Guha R., Ng S. A. A. (2019). Machine Learning Analysis of Seasonal and Cyclical Sales in Weekly Scanner Data. NBER Working Paper, 25899. https://doi.org/10.3386/w25899.
14. Hong M., Wang X., Li Z. (2022). Will Oil Price Volatility Cause Market Panic? Energies, 15, 4629. https://doi.org/10.3390/en15134629.
15. Inozemtsev E. S., Krotova Ju. I. (2024). Phillips curve with spatial effects on Russian regions data. Zhurnal Novoj jekonomicheskoj associacii = Journal of the New Economic Association, 2 (63), 35-56. (In Russ.). https://doi.org/10.31737/22212264_2024_2_35-56.
16. Ivanova V. I. (2015). Price convergence in the grain market: a historical perspective. Prostranstvennaya Ekonomika = Spatial Economics, 3, 34-56. (In Russ.). http://dx.doi.org/10.14530/se.2015.3.034-056.
17. Kirillov A. M. (2017). Spatial Analysis of Food Inflation in Russian Regions. Prostranstvennaya Ekonomika = Spatial Economics, 4, 41-58. (In Russ.). https://doi.org/10.14530/se.2017.4.041-058.
18. Kirillov A. M. (2021). Investigating Spatial Autocorrelation: The Case of Russian Regional Inflation. Prostranstvennaya Ekonomika = Spatial Economics, 4 (64), 5-22. (In Russ.). https://doi.org/10.22394/1993-7601-2021-64-5-22.
19. Kitenge E. M., Morshed A. K. M. M. (2019). Price convergence among Indian cities: The role of linguistic differences, topography, and aggregation. Journal of Asian Economics, 61, 34-50. https://doi.org/10.1016/j.asieco.2019.02.002.
20. Kotanyan A. V., Markovskaya M. A., Speko M. S. (2024). Seasonality as the main factor in the development of the ice cream market in Russia. Humanitarian scientific bulletin = Gumanitarnyj nauchnyj vestnik, 4, 162-165. (In Russ.). https://doi.org/10.5281/zenodo.11230269.
21. Leclair M., Léonard I., Rateau G., Sillard P., Varlet G., Vernédal P. (2019). Scanner Data: Advances in Methodology and New Challenges for Computing Consumer Price Indices. Economie et Statistique / Economics and Statistics, 509, 13-29. https://doi.org/10.24187/ecostat.2019.509.1981.
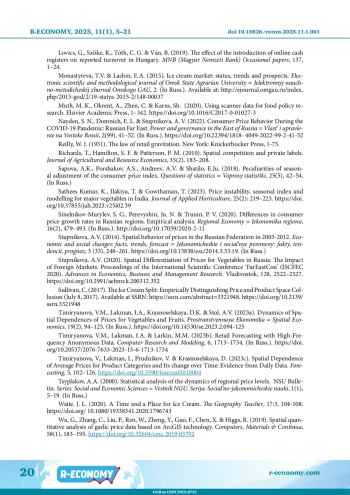
22. Lovics G., SzÖke K., Tоth C. G., Vаn B. (2019). The effect of the introduction of online cash registers on reported turnover in Hungary. MNB (Magyar Nemzeti Bank) Occasional papers, 137, 1-24.
23. Monastyreva T. V., Lashin E. A. (2015). Ice cream market: status, trends and prospects. Electronic scientific and methodological journal of Omsk State Agrarian University = Jelektronnyj nauchno-metodicheskij zhurnal Omskogo GAU, 2. (In Russ.). Available at: http://ejournal.omgau.ru/index.php/2015-god/2/19-statya-2015-2/148-00037.
24. Muth M. K., Okrent A., Zhen C., Karns Sh. (2020). Using scanner data for food policy research. Elsivier Academic Press, 1-342. https://doi.org/10.1016/C2017-0-01027-3.
25. Nayden S. N., Domnich E. L., Stupnikova A. V. (2022). Consumer Price Behavior During the COVID-19 Pandemic: Russian Far East. Power and governance in the East of Russia = Vlast’ i upravlenie na Vostoke Rossii, 2(99), 41-52. (In Russ.). https://doi.org/10.22394/1818-4049-2022-99-2-41-52.
26. Reilly W. J. (1931). The law of retail gravitation. New York: Knickerbocker Press, 1-75.
27. Richards T., Hamilton S. F., Patterson P. M. (2010). Spatial competition and private labels. Journal of Agricultural and Resource Economics, 35(2), 183-208.
28. Sapova A. K., Porshakov A. S., Andreev A. V., Shatilo E. Ju. (2018). Peculiarities of seasonal adjustment of the consumer price index. Questions of statistics = Voprosy statistiki, 25(5), 42-54. (In Russ.).
29. Sathees Kumar K., Ilakiya T., Gowthaman T. (2023). Price instability, seasonal index and modelling for major vegetables in India. Journal of Applied Horticulture, 25(2): 219-223. https://doi.org/10.37855/jah.2023.v25i02.39.
30. Sinelnikov-Murylev S. G., Perevyshin Ju. N., Trunin P. V. (2020). Differences in consumer price growth rates in Russian regions. Empirical analysis. Regional Economy = Jekonomika regiona, 16(2), 479-493. (In Russ.). http://doi.org/10.17059/2020-2-11.
31. Stupnikova A. V. (2014). Spatial behavior of prices in the Russian Federation in 2003-2012. Economic and social changes: facts, trends, forecast = Jekonomicheskie i social’nye peremeny: fakty, tendencii, prognoz, 3 (33), 248-261. https://doi.org/10.15838/esc/2014.3.33.19. (In Russ.).
32. Stupnikova A. V. (2020). Spatial Differentiation of Prices for Vegetables in Russia: The Impact of Foreign Markets. Proceedings of the International Scientific Conference ‘FarEastCon’ (ISCFEC 2020). Advances in Economics, Business and Management Research. Vladivostok, 128, 2522-2527. https://doi.org/10.2991/aebmr.k.200312.352.
33. Sullivan C. (2017). The Ice Cream Split: Empirically Distinguishing Price and Product Space Collusion (July 8, 2017). Available at SSRN: https://ssrn.com/abstract=3321948. https://doi.org/10.2139/ssrn.3321948.
34. Timiryanova V. M., Lakman I. A., Krasnoselskaya D. K., Stol A. V. (2023a). Dynamics of Spatial Dependences of Prices for Vegetables and Fruits. Prostranstvennaya Ekonomika = Spatial Economics, 19(2), 94-125. (In Russ.). https://doi.org/10.14530/se.2023.2.094-125.
35. Timiryanova V. M., Lakman I. A., Larkin M. M. (2023b). Retail Forecasting with High-Frequency Anonymous Data. Computer Research and Modeling, 6, 1713-1734. (In Russ.). https://doi.org/10.20537/2076-7633-2023-15-6-1713-1734.
36. Timiryanova V., Lakman I., Prudnikov V., Krasnoselskaya D. (2023c). Spatial Dependence of Average Prices for Product Categories and Its change over Time: Evidence from Daily Data. Forecasting, 5, 102-126. https://doi.org/10.3390/forecast5010004.
37. Tsyplakov A. A. (2000). Statistical analysis of the dynamics of regional price levels. NSU Bulletin. Series: Social and Economic Sciences = Vestnik NGU. Serija: Social’no-jekonomicheskie nauki, 1(1), 5-19. (In Russ.).
38. Waite J. L. (2020). A Time and a Place for Ice Cream. The Geography Teacher, 17:3, 104-108. https://doi.org/10.1080/19338341.2020.1796743.
39. Wu G., Zhang C., Liu P., Ren W., Zheng Y., Guo F., Chen X., Higgs,R. (2019). Spatial quantitative analysis of garlic price data based on ArcGIS technology. Computers, Materials & Continua, 58(1), 183-195. https://doi.org/10.32604/cmc.2019.03792.
Выпуск
Другие статьи выпуска
Relevance. The interconnectedness of global financial markets implies that shocks in one region can have widespread implications. The recent geopolitical tensions in the Middle East and Western Europe, have significantly heightened Geopolitical Risk (GPR) and Economic Policy Uncertainty (EPU). Country-specific financial stability can experience ripple effects from these external sources of risk, indicating a direct link between geopolitical events and economic policy uncertainties that contribute to financial stress. Research Objective. This study examines the risk spillovers from Global Geopolitical Risk (GLGPR) and Economic Policy Uncertainty (GLEPU) to the country-wise Financial Stress Index (FSI) of the USA, China, and Russia. Our goal is to determine which of these giants demonstrates superior resilience in terms of financial stability against these external sources of risks. Data and Methods. Using Cross-Quantilogram (CQ), Partial-CQ and Recursive-CQ (R-CQ), we evaluate a weekly high-frequency data from 2000 to 2023 to identify patterns of these spillover effects. Results. Our findings indicate that GLGPR has mixed spillover effects on the USA’s FSI under varying market conditions, while the FSI shows long-term resilience to GLEPU. For China, GLGPR only boosts the FSI during long-term bullish markets, and GLEPU demonstrates pronounced adverse impact at the bullish market. In contrast, the Russian FSI reacts unevenly to both GLGPR and GLEPU, experiencing greater severity. Overall, the USA’s financial market exhibits the highest resilience to GLEPU, while the Chinese market demonstrates the greatest resilience to GLGPR. In contrast, the Russian financial market shows the highest exposure to these global risks. Conclusions. No previous empirical study has examined the financial stress response of these three globally powerful economies to external sources of risk such as GLGPR and GLEPU. Most of the previous research focuses solely on stock market returns or their volatility in relation to these risks, whereas we focus on a composite measure of stability that encompasses all four sectors of a financial market. Our research fills this gap, particularly in the context of current geopolitical tensions among these global players, making it highly relevant for both academics and policymakers.
Relevance. Similar to other countries, Indonesia’s economy was significantly impacted by the COVID-19 pandemic, especially at the district and city levels. As the second-largest contributor to Indonesia’s GDP, East Java faced noticeable economic downturns. Industry, the region’s main economic sector, played a key role in these challenges, making it essential to evaluate all sectors from a regional economic perspective to navigate this turbulence effectively. Research objective. This study investigates the regional economy’s sectoral competitiveness in East Java, with a particular focus on the 17 sectors categorized by Statistic Indonesia (Badan Pusat Statistik-BPS) before and after COVID-19. Data and methods. The study relies on data from Badan Pusat Statistik (BPS)). The dataset includes GDP information for 11 regions, namely 7 districts and 4 cities, in East Java from 2018 to 2022, covering the pre- and post-pandemic periods. Methodologically, the study employed Location Quotient (LQ) analysis and Mix and Share Analysis. LQ analysis was used to assess the concentration and comparative advantage of East Java’s regions. Mix and Share and Shift-Share analyses were applied to identify the competitive industries in specific regions and their advantages. Results. The findings show positive economic growth in most regions of East Java before and after the pandemic, except for two regencies that saw a decline. The study emphasizes the need to strengthen regional resilience at the village level using the Village Fund from the national budget. Conclusions. Regional stakeholders, central government interventions, and continued development of leading sectors are essential for mitigating the effects of COVID-19. According to regional economic theory, collaboration between the government and businesses is crucial for enhancing competitive advantage and increasing the number of leading sectors.
Relevance. The digital economy and the digitalization of business and public administration are progressing rapidly in Russia. However, significant disparities in ICT access, usage, and outcomes between regions persist, potentially contributing to widening socio-economic inequalities. Research objective. This study aims to demonstrate that digital skills are a key factor in regional development. It tests the hypothesis that regions with disparities in Internet adoption and digital skills also experience disparities in regional development, as reflected in key socio-economic indicators. Additionally, the study analyzes the impact of digital skills on per capita income and unemployment. Data and methods. The study uses data from a sociological survey conducted by the Federal Statistics Service (Rosstat) and the Higher School of Economics to characterize the digital skills of the population. Principal component analysis is applied to construct a composite index, the Internet Adoption Index, which reflects both the accessibility and use of the Internet across Russian regions. This index, alongside digital skills data, is used to group regions. Two-sample t-tests for equal and unequal variances are employed for initial comparisons of regional indicators. In the second stage, regression analysis is used to test the hypothesis that without improved digital skills, access to ICT does not lead to higher personal income or lower unemployment. Results. The study reveals that only 12 out of the considered 83 Russian regions exhibit relatively high levels of Internet adoption and above-average digital skills. Despite well-developed infrastructure, many regions still have low levels of digital proficiency. The age and gender structure of the population have little impact on regional digital skills. However, regions with greater access to the Internet and higher digital skills show higher economic growth, higher incomes, and lower unemployment. Conclusion. The findings provide strong evidence that digital skills are closely linked to socio-economic development. The results highlight the importance of policies aimed at improving digital literacy, particularly as the digital economy continues to expand.
Relevance. Uneven spatial development is a common challenge for all countries, driven by both subjective and objective factors. The issue lies not in regional disparities themselves but in their growing intensity. Amid crises and economic turbulence, it is crucial to have tools to assess the risks of increasing spatial unevenness and widening socio-economic disparities between regions. Research Objective. This study aims to develop and test a tool for estimating the risks of uneven spatial development in Russia’s macroregions and the growing differentiation of regions by socio-economic level, using the Urals-Siberian macroregion as a case study. Data and Methods. A two-stage approach is proposed to evaluate spatial development in terms of uniformity and regional differentiation by socio-economic level and growth rate. In the first stage, the probability of a socio-economic decline is estimated based on key indicators (risk factors) and their dynamic indices. In the second stage, the probability of an increasing variation coefficient within a macroregion, reflecting rising disparities in socio-economic development, is analyzed. A multifactor risk model is used for analysis. The study relies on data from the Federal State Statistics Service (Rosstat) covering the period from 2000 to 2022. Results. Applying this approach to the Urals-Siberian macroregion revealed persistent spatial unevenness throughout the study period, primarily due to the specialization of regions, which stabilizes their relative positions. However, during crises, spatial disparities tend to widen as regions demonstrate varying adaptive capacities and resilience - some not only recover but also improve their positions. Conclusion. The proposed tool assesses risks linked to uneven development and growing regional disparities, offering insights for sustainable macroregional strategies. The findings emphasize the need to consider regions’ specificities and adaptive capacities in spatial development policies.
Relevance. As interregional competition intensifies, state support for innovation in regional economies becomes increasingly important. To improve the effectiveness of such support, it is necessary to gain a better understanding of the link between innovation and economic development. Research Objective. The study aims to assess the impact of innovation activity on regional economic growth, focusing on the case of a large industrial region in Russia. Data and Methods. The analysis uses socio-economic data for Sverdlovsk region from 2000 to 2023 and applies an autoregressive distributed lag (ARDL) model to assess the relationship between innovation and economic performance. The study introduces an Innovation Activity Index, which incorporates several key components, such as the number of research personnel, internal R&D expenditures, and other relevant indicators, for a more comprehensive evaluation. Results. The study traces the region’s innovation activity, revealing a general upward trend. However, while innovation clearly has a positively influence on economic growth in the short term, its effects over medium- and long-term periods are less obvious, likely due to structural factors in the regional economy. Conclusion. The study proposes recommendations to enhance regional innovation support within the «smart specialization» framework, including backing innovation projects, developing a sustainable innovation ecosystem, and investing in human capital.
Relevance. The process of new industrialization extends beyond traditional industrial sectors to include areas such as the creative industries. Since 2021, there has been a growing interest in creative activities, supported by legislative measures and strategic frameworks aimed at promoting spatial and technological development. This trend suggests a novel hypothesis: creative industries in single-industry towns can serve as catalysts for new industrialization by leveraging information and telecommunications activities. This study focuses on single-industry towns-a complex and underexplored subject-and proposes adopting a regional ‘center-periphery’ model as a framework for analysis. Research objective. The study aims to establish conceptual and methodological bases for the spatial socio-economic development of creative industries in Russia by focusing on the case of single-industry towns of Sverdlovsk and Kemerovo regions. Data and methods. This study introduces a methodological framework for evaluating the developmental potential of creative new industrialization, driven by advancements in information and telecommunications. While exploring the concepts of creative neo-industrialization and re-industrialization, the key innovation lies in classifying information and telecommunications as integral components of the creative industries, reflecting broader technological trends. This approach enables the development and testing of spatial models for creative industry growth, considering factors such as institutional constraints, concentration levels, and the potential for creative startups in single-industry towns. Results. The study highlights the concentration of creative industries around emerging local growth points, shaped by technological trends, increased industry concentration, and a declining share of startups in single-industry towns and regional administrative centers. The regions under study show different spatial models of creative new industrialization. In Sverdlovsk region, a center-semi-periphery-periphery model emerged by 2015, with Yekaterinburg at the center. In Kemerovo region, Kemerovo became the center by 2022, following growth transfers from Belovo and Leninsk-Kuznetsk in 2019 and 2021. Conclusions. This study contributes to applied research by integrating the evolutionary theory of growth with the center-periphery model and institutional economics.
Статистика статьи
Статистика просмотров за 2025 год.
Издательство
- Издательство
- УрФУ
- Регион
- Россия, Екатеринбург
- Почтовый адрес
- 620002, Свердловская область, г. Екатеринбург, ул. Мира, д. 19
- Юр. адрес
- 620002, Свердловская область, г. Екатеринбург, ул. Мира, д. 19
- ФИО
- Кокшаров Виктор Анатольевич (Ректор)
- E-mail адрес
- rector@urfu.ru
- Контактный телефон
- +7 (343) 3754507
- Сайт
- https://urfu.ru/ru
